
A dedicated screen
In the PIM, there is a dedicated dashboard that will help you monitor your catalog size along a variety of axes.
For example, you'll be able to track the number of families and the average number of attributes per family.
Where is it?
To access this amazing (😉) screen, follow these very simple steps:
- Click on the Activity menu
- Click on the Catalog volume monitoring menu entry
- Enjoy!
How to read this dashboard?
The different sections
The Catalog volume monitoring screen is composed of several sections.
THE MOST IMPORTANT ONE
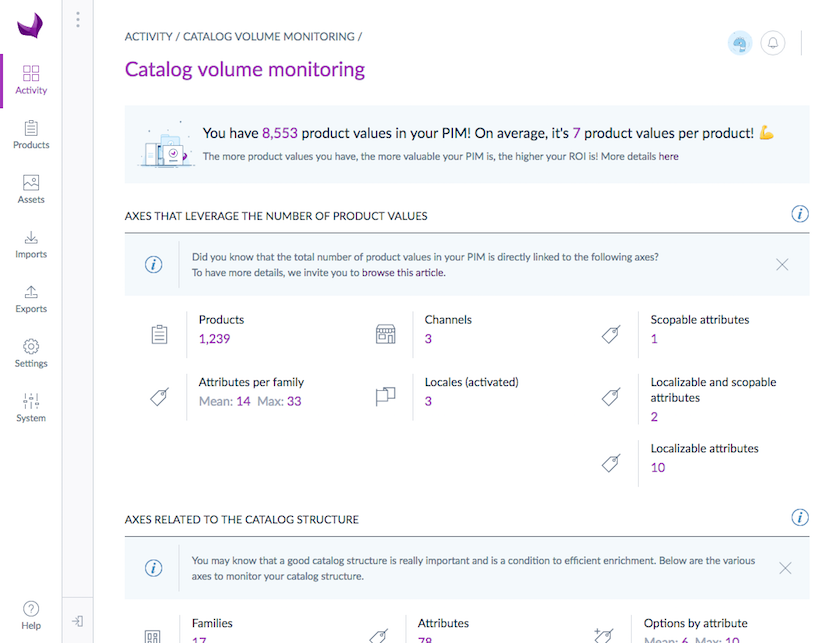
The first one is the most important one. It gives you the total number of product values that your PIM actually holds. This indicator gives you a representation of how extensive and valuable your PIM is.

We really encourage you to give a look at it from time to time. The more product values you have, the more useful your PIM is!
We wrote an article to explain why the number of product values is a very interesting axis to measure the size of your catalog. The article is a bit long but we promise you, it's really enlightening. You will never think about the size of the catalog you have to manage in the same way you did before. 😉
You can't see the widget we are talking about? What a shame!
If you are a Community Edition user or working on the On-Premise or PaaS version, it's probably because you or your administrator didn't launch the CRON job to calculate the values shown in this widget.
To do so, please refer to our technical documentation: over here for CE and over there for EE.
THE OTHER SECTIONS
The next section Axes that leverage your number of product values is dedicated to the various axes that can influence the number of product values.
For example, the more channels or locales you have, the more product values you will have.
The Axes related to the catalog structure section gathers all the axes that have an impact on your catalog structure.
The Axes regarding the variant modeling section gathers the number of product models and variant products.
In the Enterprise Edition, there is an additional section called Axes on assets that will give you the volume regarding assets.
The alerts
On some axes, you will sometimes see an alert: text appears below the metric and the axis icon is colored in purple.
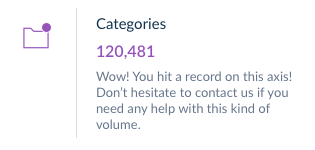
What does this alert means?
It simply means that for this axis, you may have a volume that is quite high. If you encounter any problems at this level of volume, do not hesitate to contact us.