Introducing our quality score!
A NEW WAY OF SCORING…
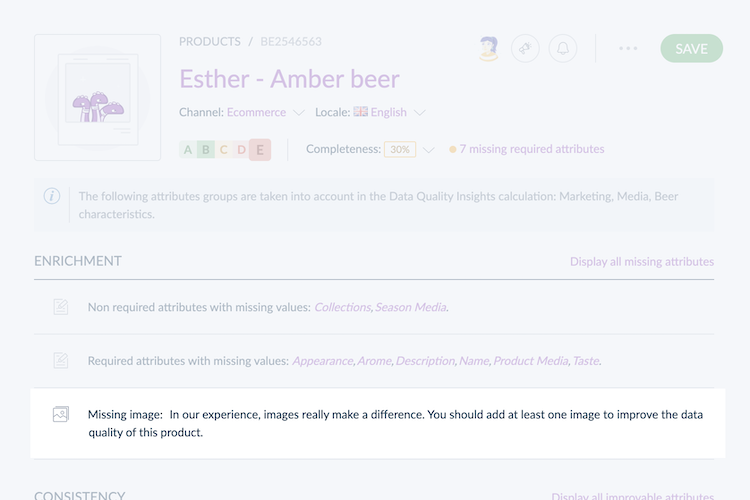
Measuring your product quality is now easier than ever thanks to the quality score, our new simplified way to score your product. It replaces the enrichment and consistency grades for better clarity.

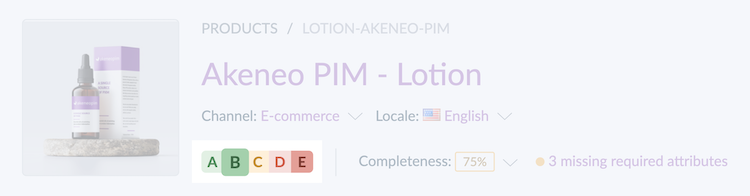
You can now find this score next to the completeness in the header of each product page, as well as in the product grid. Don't hesitate to use it as a filter to focus your attention on the products with low-quality scoring.
...ALL YOUR PRODUCTS…
You'll also notice that this score and the Data Quality Insights tab are now available for both your variant products and product models! You get specific quality scores for all your variant products so you can quickly identify the list of attributes you need to improve for a specific variant product. We also deliver a quality score at the product model level so you can see at a glance on which level the attributes need to be improved (at the variant product or at the product model level).

When you have improvement recommendations, you can simply click on your attribute and improve it right from the Data Quality Insights tab. This will make your job easier and allow you to react to poor data quality faster.
...ON SELECTED ATTRIBUTES!
You can now select the product attributes you want to take into account when calculating your product quality score. You can enable this option at the attribute group level on the attribute group settings page.
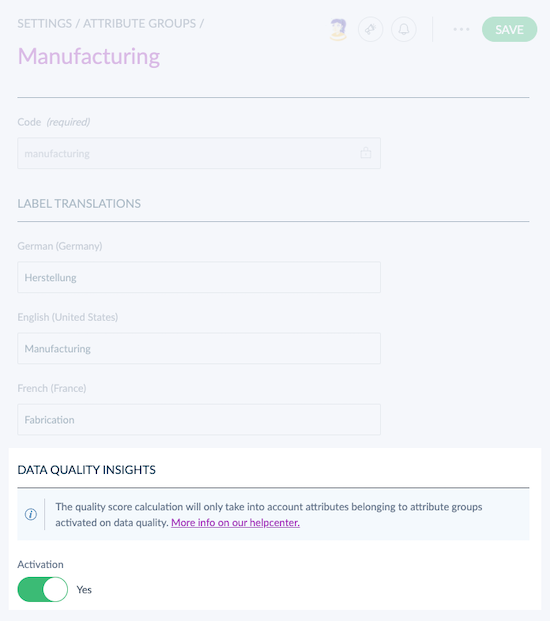
This option comes with a dedicated permission. So don't hesitate to ask your PIM admin to give you the right to enable/disable the feature.
A revamped data quality dashboard
Under the Activity menu, discover a totally reworked Data Quality Insights dashboard to easily follow the catalog's data quality. An improved UX, a new chart and key indicators help you get a better overview of your progress and your current situation when it comes to this crucial topic: the quality of your product information.
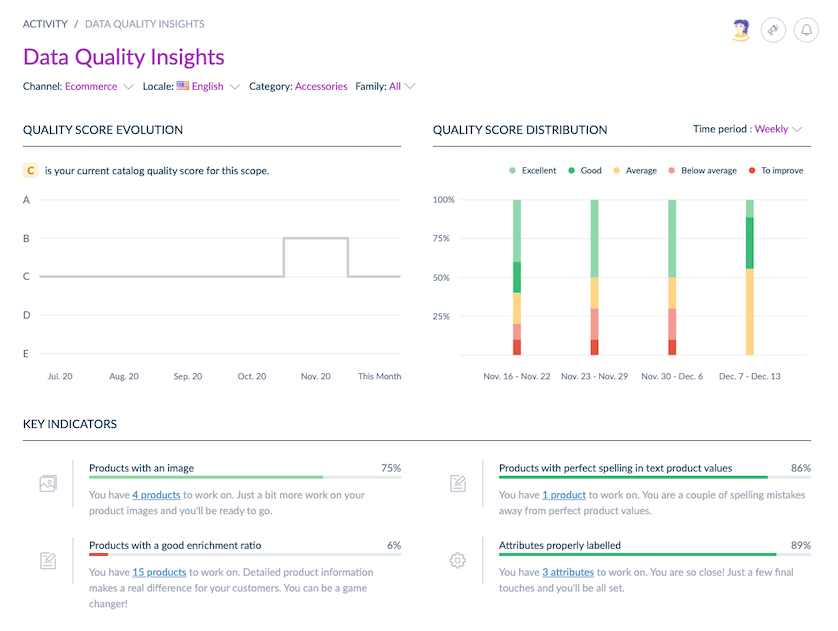
A step chart displays the overall quality score evolution on a monthly basis.
New key indicators draw your attention to specific quality criteria, such as the percentage of products without images. Those indicators are taken into account in the quality score, don't hesitate to use them to drive your product enrichment and to reach a better quality score.
Spell-check improvements
ON ATTRIBUTE AND OPTION LABELS
Now, you can also benefit from spell-checking on attribute and option labels to guarantee the consistency of your customer-facing product data.
You can find this improvement on the attribute and attribute option setting pages.
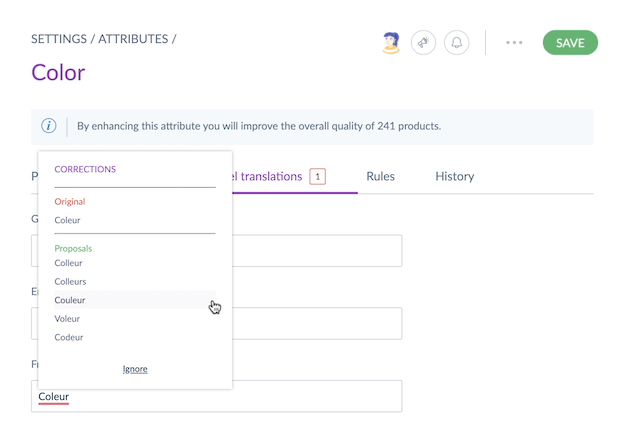
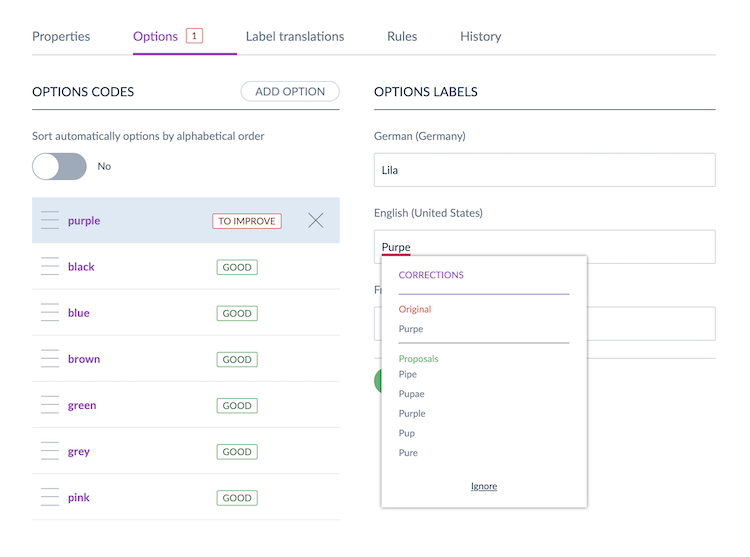
This feature is also available in the product form. New recommendations are listed, should we find errors. The better the content, the higher the quality score! 😉
WITH NEW LANGUAGES SUPPORTED
The spell-check feature now supports 7 new languages: Italian 🇮🇹, Swedish 🇸🇪, Danish 🇩🇰, Dutch 🇳🇱, Norwegian Bokmål 🇳🇴, Norwegian Nynorsk 🇳🇴 , and Brazilian Portuguese 🇧🇷 bringing the total number of supported languages to 11! With spelling mistakes automatically detected for so many locales, you will ensure data quality for most of your content! 😉
ON TEXT AREA ATTRIBUTES WITH RICH TEXT EDITOR ENABLED
To help reach higher data quality content, spell-check and suggestions are now available on text area attributes with rich text editor enabled (WYSIWYG).
FOR SINGLE LOCALE PIM
For those of you who have a catalog with only one locale enabled, we've got some great news for you. You can now benefit from our spell-checking feature for all your text and text area attributes if your locale is one of the 11 supported languages.
New "Missing image" criteria
Type: New | Available in Enterprise Edition Community Edition
You all know the expression a picture is worth a thousand words, don't you? Images play a critical role in designing compelling product experiences. We now check whether your products have an image or not, and highlight it under the Data Quality Insights menu in your product forms, and also show this criteria as a key indicator on our revamped Data Quality Insights dashboard.
Don’t forget them, otherwise, it will reduce your quality score!