

About data quality
What is this red, orange or green A, B, C, D, E displayed on my product edit form? What are the enrichment and consistency grades?
This is data quality insights!
Because rich, coherent and consistent product data is important in order to deliver great product experiences, we introduced the concept of "data quality" in our PIM.
This new capability helps you measure your data quality along two axes: enrichment and consistency.
Each of these two axes has a score from A to E. The scores can be seen on several PIM screens.
How is enrichment calculated?
The enrichment grade is calculated as the percentage of attributes with values in your product edit form (whether the attributes are required for completeness or not).
Checking the data quality insights panel in the product edit form allows you to quickly see which attributes need to be filled in to improve your data quality grade for enrichment.
From the data quality insights panel, by clicking on the "Display all missing attributes", you can easily access a product edit form filtered on all the attributes that need to be filled in.
How is the quality score calculated?
The consistency grade is calculated on several criteria. The mix of the following criteria helps the PIM determine the grade for consistency:
- Spell check: text and text areas are checked for spelling mistakes.
- Uppercases formatting: the PIM checks whether text area attributes are correctly formatted for upper cases.
- Lowercases formatting: the PIM checks whether text area attributes are correctly formatted for lower cases.
Spell check is available for English, French, German and Spanish locales. Spell check is usable with text and simple text area attributes
From the data quality insights panel, by clicking on the "Display all improvable attributes", you can easily access a product edit form filtered on all the attributes that need to be checked for consistency.
Where to see data quality grades?
TData quality grades for enrichment and consistency are displayed as badges on PIM screens.
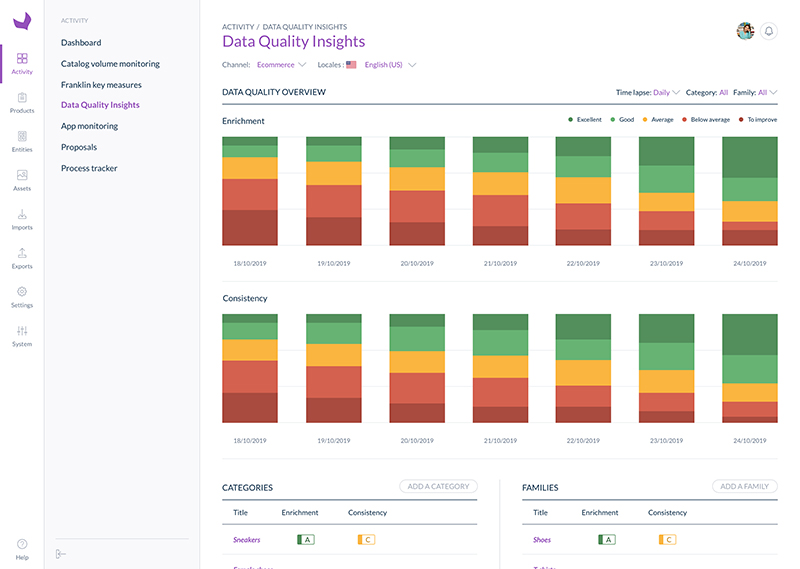
On your dashboard
Your dashboard offers multiple ways of measuring your catalog's enrichment and consistency. You can choose to view data quality on the whole catalog, on a family, or on a category.
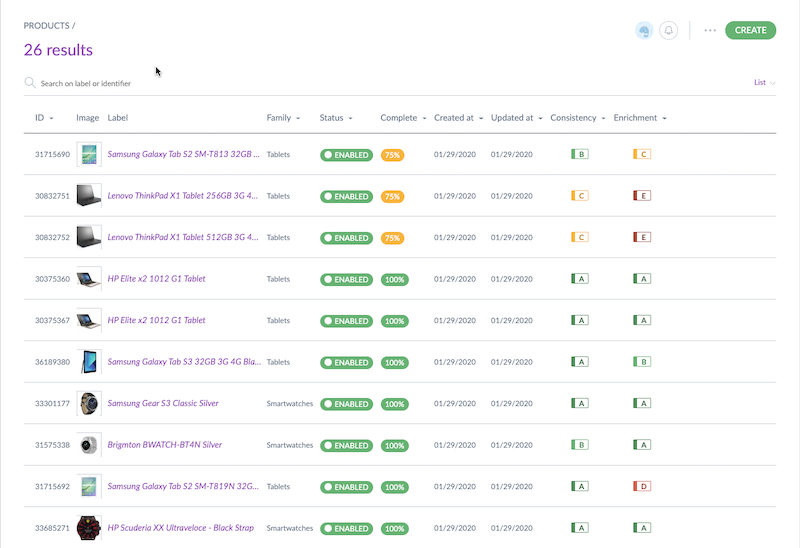
In your product grid
Your product grid displays the quality score for each product.
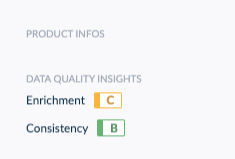
On your product edit form
Your product edit form displays the quality score for each product.
Enrichment and consistency grades are not yet calculated on variant products and product models. Stay tuned for our future releases!
In your data quality insights panel (product edit form)
Clicking on data quality insights in the product edit form takes you to a dedicated panel where you'll find recommendations to understand your quality score and improve it if needed.
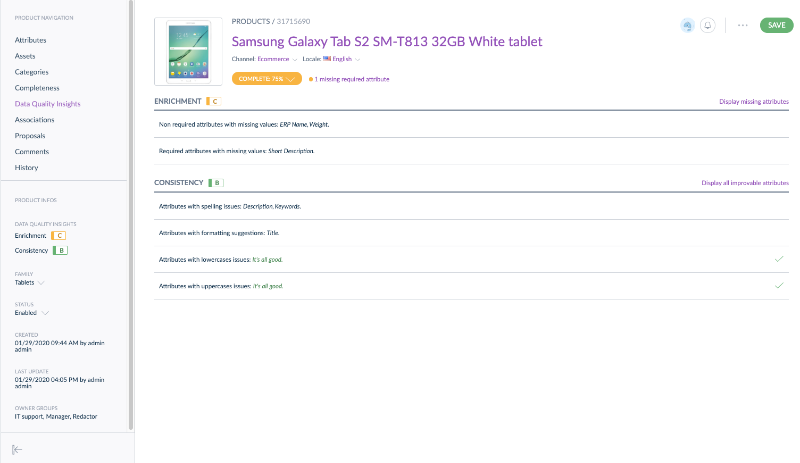
Thanks to the data quality panel, get recommendations on how to improve your data quality grades!
How often are the data quality grades refreshed?
The grades are updated:
- after an import,
- after a product is saved.