

Overview
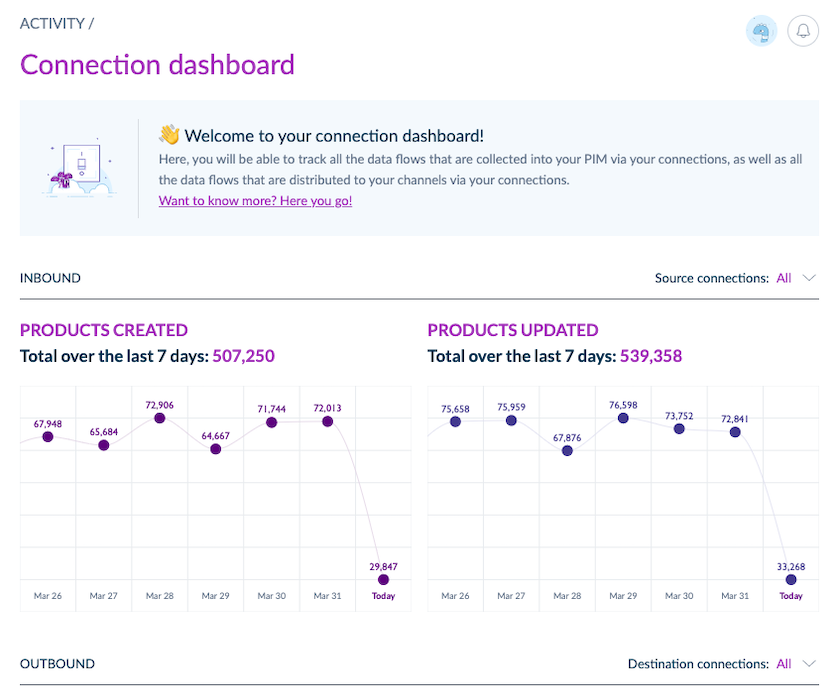
In the PIM, there is a dashboard called Data flows, to help you follow your connections activity. You can access it by clicking on the Connect menu, then on the Data flows submenu. And here you are! 🎉
This is still the very first version of this dashboard. In the future, it will show you many more indicators. Stay tuned! 🙂
And also, don't hesitate to fill in the survey at the bottom of the dashboard page to vote for the next KPI you'd like to see in there.
In this dashboard, for now, you can monitor both your source and destination connections.
Empty charts? Have you ticked the Track this connection in the dashboard checkbox in your connections settings? Do you use the connection user to call the PIM through the API?
Source connection monitoring
In this dashboard, you can easily track the following indicators from your source connections:
- the number of products that were created and updated over the last 7 days for each source,
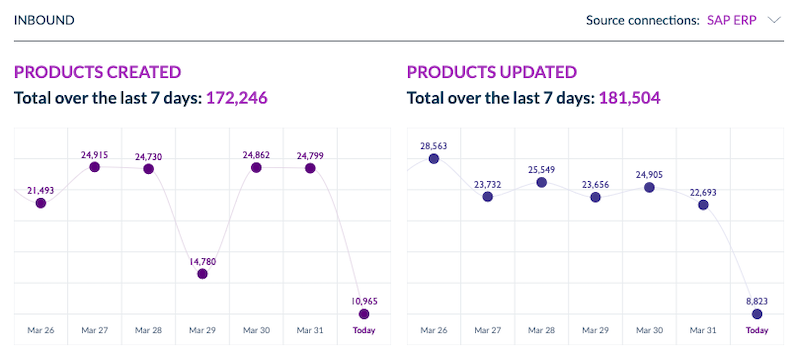
- the number of products that were created and updated over the last 7 days by all your sources
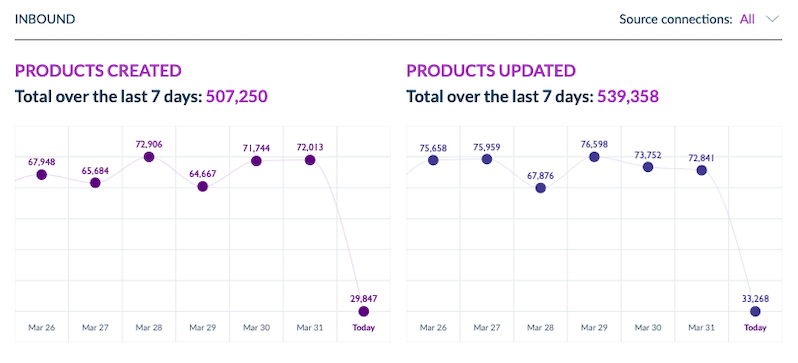
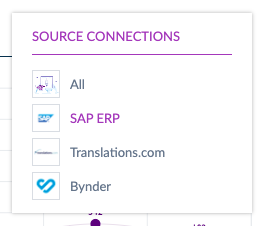
You can easily switch the source connection you want to monitor by clicking on the following dropdown.
Destination connection monitoring
In this dashboard, you can easily track the following indicators from your destination connections:
- the number of products sent to each of your destinations over the last 7 days,
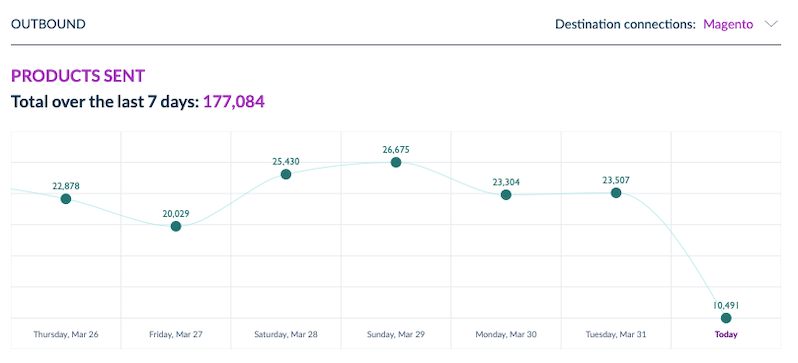
- the total number of products sent to all of your destinations over the last 7 days.
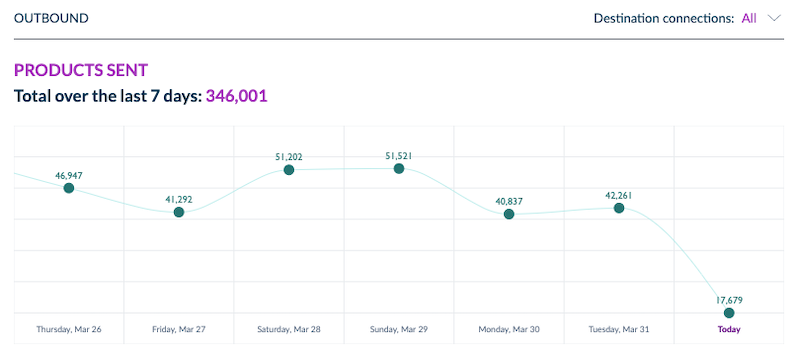
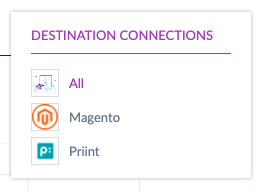
You can easily switch the destination connection you want to monitor by clicking on the following dropdown.
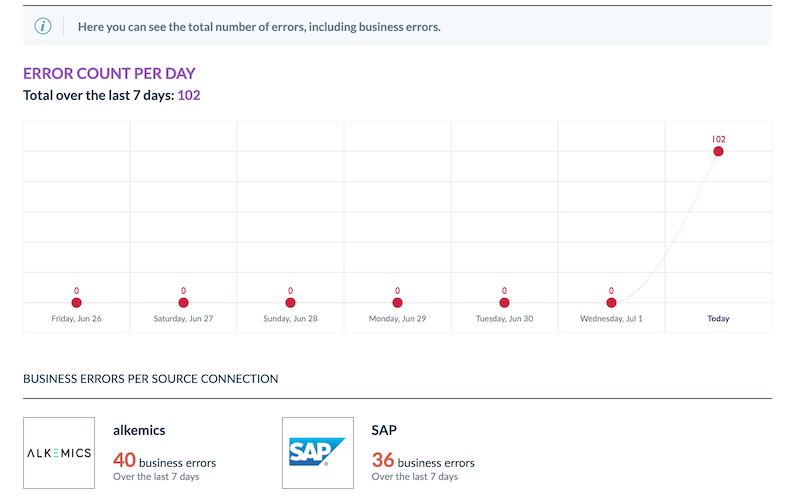
Error monitoring
In Data flows
In this dashboard, you can easily track product errors that occurred over the last 7 days.
- The graph shows the number of product errors (business and technical),
- and connection cards display the number of business errors for the past week.
Julia could solve business errors from the PIM or in the connected application. On the contrary, technical errors can't be resolved without a developer or a technical profile intervention.
For example, a The title attribute must not contain more than 250 characters. The submitted value is too long. error is considered as a business error because Julia could solve it by changing the value of the related attribute. But a Property does not exist error is regarded as a technical error because it can't be solved without modifying the connector.
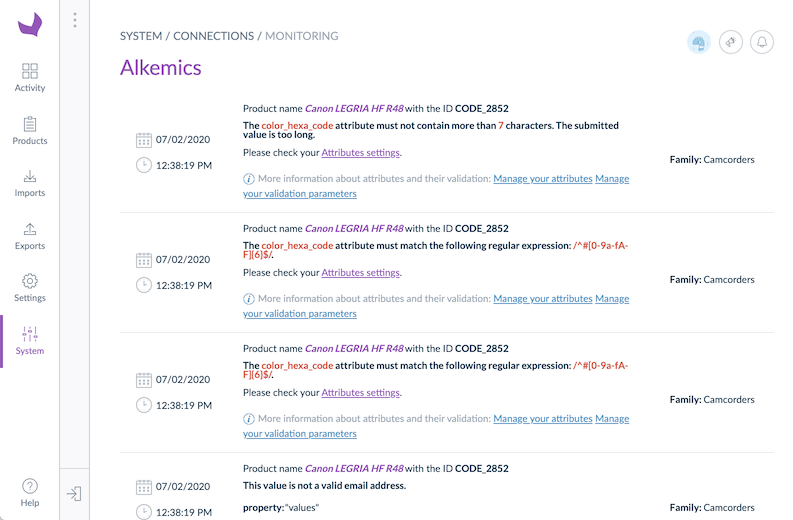
In the connection Monitoring page
You can access the Monitoring page by clicking directly on a connection card in the Data flows dashboard or in the Connect menu, then Connection settings, and on your connection card.
This page displays information about the last 100 business errors.
Each message contains 3 parts:
- the message: to explain what went wrong during the connection synchronisation,
- internal links: to help you to check the right data inside your PIM,
- external links: to access directly the right pages in our help center.
Moreover, we display some information about the related product:
- its label and identifier,
- its family,
- and when this is relevant, the attribute channel and locale.
Finally, above the list, you will find a search bar to filter messages. 🔍
For now, we only track errors on product creation, update, or deletion.